16일 차 회고.
아직도 목이 다 낫지 않아서 수업 시간 동안 힘들었다. 오늘 토이 프로젝트 발표날이었는데, 팀원들이 양해해 준 덕에 이번에는 발표를 맡지 않았다. 그리고 알고리즘 스터디에 참여할 시간이 나지 않을 것 같아서 빠지기로 했다. 조금씩 혼자서 할 수밖에 없을 것 같다. 또 SQLD 자격증 시험을 신청했는데 ADsP 시험이 끝나면 바로 SQLD 공부를 시작할 예정이다.
1. Pandas
1-1. groupby
Load Dataset
df = sns.load_dataset('titanic')
df_tmp = df[['survived', 'age', 'fare', 'pclass', 'sex']]
groupby()
groupby() 함수는 nunique가 10 미만일 경우에 사용하는 것이 좋다.
df_tmp['sex'].unique()				# array(['male', 'female'], dtype=object)
df_tmp['sex'].nunique()				# 2

groups = df_tmp.groupby(['sex'])
type(groups)					# pandas.core.groupby.generic.DataFrameGroupBy

for i in groups:
    print(f"{type(i)} & {len(i)}")
# <class 'tuple'> & 2 -> 'male'
# <class 'tuple'> & 2 -> 'female'

for i1, i2 in groups:
    print(f"{type(i1)} {len(i1)} & {type(i2)} {i2.shape}")
# <class 'tuple'> 1 & <class 'pandas.core.frame.DataFrame'> (314, 5)
# <class 'tuple'> 1 & <class 'pandas.core.frame.DataFrame'> (577, 5)

for i1, i2 in groups:
    print(f"{i1[0]} & {type(i2)} {i2.shape}")
# female & <class 'pandas.core.frame.DataFrame'> (314, 5)
# male & <class 'pandas.core.frame.DataFrame'> (577, 5)

for key, df_group in groups:
    print(f"{key[0]} & {df_group.shape}")
# female & (314, 5)
# male & (577, 5)

for key, df_group in groups:
    print("-" * 43)
    print(f"{key[0]} & {df_group.shape}")
    print(df_group.head())
# -------------------------------------------
# female & (314, 5)
#    survived   age     fare  pclass     sex
# 1         1  38.0  71.2833       1  female
# 2         1  26.0   7.9250       3  female
# 3         1  35.0  53.1000       1  female
# 8         1  27.0  11.1333       3  female
# 9         1  14.0  30.0708       2  female
# -------------------------------------------
# male & (577, 5)
#    survived   age     fare  pclass   sex
# 0         0  22.0   7.2500       3  male
# 4         0  35.0   8.0500       3  male
# 5         0   NaN   8.4583       3  male
# 6         0  54.0  51.8625       1  male
# 7         0   2.0  21.0750       3  male
통계 데이터
groups.mean()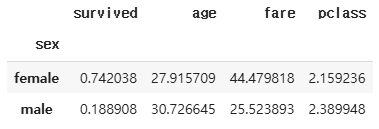
groups.median()
df_female = groups.get_group(('female',))
df_female.head()
groupby()
df_tmp['pclass'].unique()				# array([3, 1, 2])
df_tmp['pclass'].nunique()				# 3

groups = df_tmp.groupby(['sex', 'pclass'])

for key, df_group in groups:
    print("-" * 43)
    print(f"{key} & {df_group.shape}")
    print(df_group.head(2))

# -------------------------------------------
# ('female', 1) & (94, 5)
# survived   age     fare  pclass     sex
# 1         1  38.0  71.2833       1  female
# 3         1  35.0  53.1000       1  female
# -------------------------------------------
# ('female', 2) & (76, 5)
#     survived   age     fare  pclass     sex
# 9          1  14.0  30.0708       2  female
# 15         1  55.0  16.0000       2  female
# -------------------------------------------
# ('female', 3) & (144, 5)
#    survived   age     fare  pclass     sex
# 2         1  26.0   7.9250       3  female
# 8         1  27.0  11.1333       3  female
# -------------------------------------------
# ('male', 1) & (122, 5)
#     survived   age     fare  pclass   sex
# 6          0  54.0  51.8625       1  male
# 23         1  28.0  35.5000       1  male
# -------------------------------------------
# ('male', 2) & (108, 5)
#     survived   age  fare  pclass   sex
# 17         1   NaN  13.0       2  male
# 20         0  35.0  26.0       2  male
# -------------------------------------------
# ('male', 3) & (347, 5)
#    survived   age  fare  pclass   sex
# 0         0  22.0  7.25       3  male
# 4         0  35.0  8.05       3  male
통계 데이터
groups.agg(['mean', 'median'])
groups['fare'].agg(['mean', 'median'])
groups['fare'].agg(lambda x: x.mean())
dict_agg = {
    'fare': ['min', 'max'],
    'age': ['mean']
}

groups.agg(dict_agg)
1-2. 2개 이상의 DataFrame 조작
Create DataFrame
left = pd.DataFrame(
    {
        'key': ['KO', 'K1', 'K2', 'K3'],
        'A': ['A0', 'A1', 'A2', 'A3'],
        'B': ['B0', 'B1', 'B2', 'B3']
    }
)

right = pd.DataFrame(
    {
        'key': ['KO', 'K1', 'K2', 'K3'],
        'C': ['C0', 'C1', 'C2', 'C3'],
        'D': ['D0', 'D1', 'D2', 'D3']
    }
)

print(left.shape)			# (4, 3)
print(right.shape)			# (4, 3)
merge() - inner join
df = pd.merge(left, right, on='key')
print(f"{left.shape} / {right.shape}")		# (4, 3) / (4, 3)
df.shape					# (4, 5)

df.head()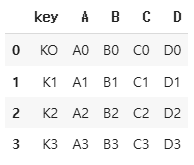
Create DataFrame
left = pd.DataFrame(
    {
        "key1": ["K0", "K0", "K1", "K2"],
        "key2": ["K0", "K1", "K0", "K1"],
        "A": ["A0", "A1", "A2", "A3"],
        "B": ["B0", "B1", "B2", "B3"],
    }
)


right = pd.DataFrame(
    {
        "key1": ["K0", "K1", "K1", "K2"],
        "key2": ["K0", "K0", "K0", "K0"],
        "C": ["C0", "C1", "C2", "C3"],
        "D": ["D0", "D1", "D2", "D3"],
    }
)
merge() - inner join
merge() 함수에서 how 속성을 정의하지 않을 경우, 기본적으로 inner join을 실행한다.
df = pd.merge(left, right, on=['key1', 'key2'])		# how='inner'
print(f"{left.shape} / {right.shape}")			# (4, 4) / (4, 4)
df.shape						# (3, 6)

df
merge() - left join
df = pd.merge(left, right, on=['key1', 'key2'], how='left')

df
merge() - outer join
df = pd.merge(left, right, on=['key1', 'key2'], how='outer')

df
Create DataFrame
df1 = pd.DataFrame(
    {
        "A": ["A0", "A1", "A2", "A3"],
        "B": ["B0", "B1", "B2", "B3"],
        "C": ["C0", "C1", "C2", "C3"],
        "D": ["D0", "D1", "D2", "D3"],
    },
    index=[0, 1, 2, 3],
)

df1.shape					# (4, 4)

df1
s1 = pd.Series(
    ['X0', 'X1', 'X2', 'X3'], name='X'
)

s1
concat() - column outer join(DataFrame & Series)
concat() 함수는 기준이 인덱스이며, join 속성을 정의하지 않을 경우, 기본적으로 outer join을 실행한다.
df = pd.concat([df1, s1], axis=1)

df
Create DataFrame
df2 = pd.DataFrame(
    {
        "B": ["B2", "B3", "B6", "B7"],
        "D": ["D2", "D3", "D6", "D7"],
        "F": ["F2", "F3", "F6", "F7"],
    },
    index=[2, 3, 6, 7],
)

df2
concat() - column outer join(DataFrame & Series)
df = pd.concat([df2, s1], axis=1)

df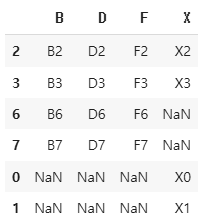
concat() - column outer join(DataFrame & DataFrame)
df = pd.concat([df1, df2], axis=1)

df
concat() 함수는 인덱스를 기준으로 join 하기 때문에, 인덱스를 재정의하게 되면, 인덱스에 따라 데이터가 사라질 수 있다.
df = pd.concat([df1, df2], axis=1).reindex([0, 1, 2, 3, 4, 5])

df
따라서, 인덱스를 재정의하고 싶을 경우, reset_index() 함수를 사용한다. 이때, index column이 생성된다.
df = pd.concat([df1, df2], axis=1).reset_index()

df
index column을 삭제하기 위해서는 drop 속성을 정의해 준다.
df = pd.concat([df1, df2], axis=1).reset_index(drop=True)

df
concat() - column inner join(DataFrame & DataFrame)
df = pd.concat([df1, df2], axis=1, join='inner')

df
concat() - row outer join(DataFrame & DataFrame)
concat() 함수는 axis 속성을 정의하지 않을 경우, 기본적으로 row를 기준으로 join을 실행한다.
df = pd.concat([df1, df2])

df
2. Data Visualization
2-1. Data Visualization
Import Library
import numpy as np
import pandas as pd

import matplotlib.pyplot as plt
import matplotlib.font_manager as fm
import seaborn as sns

# plt.rc('font', family='NanumBarunGothic')
Anscombe's quartet - Load Dataset
df_anscombe = sns.load_dataset('anscombe')

df_anscombe.shape					# (44, 3)

df_anscombe.info()
# <class 'pandas.core.frame.DataFrame'>
# RangeIndex: 44 entries, 0 to 43
# Data columns (total 3 columns):
#  #   Column   Non-Null Count  Dtype
# ---  ------   --------------  -----
#  0   dataset  44 non-null     object
#  1   x        44 non-null     float64
#  2   y        44 non-null     float64
# dtypes: float64(2), object(1)
# memory usage: 1.2+ KB

df_anscombe.head()
df_anscombe.tail()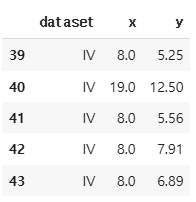
df_anscombe['dataset'].nunique()			# 4
df_anscombe['dataset'].unique()				# array(['I', 'II', 'III', 'IV'], dtype=object)
Anscombe's quartet - group
dataset_1 = df_anscombe[df_anscombe['dataset'] == 'I']
dataset_2 = df_anscombe[df_anscombe['dataset'] == 'II']
dataset_3 = df_anscombe[df_anscombe['dataset'] == 'III']
dataset_4 = df_anscombe[df_anscombe['dataset'] == 'IV']

dataset_1.shape, dataset_2.shape, dataset_3.shape, dataset_4.shape
# ((11, 3), (11, 3), (11, 3), (11, 3))
groups = df_anscombe.groupby('dataset')

dataset_1 = groups.get_group('I')
dataset_2 = groups.get_group('II')
dataset_3 = groups.get_group('III')
dataset_4 = groups.get_group('IV')

dataset_1.shape, dataset_2.shape, dataset_3.shape, dataset_4.shape
# ((11, 3), (11, 3), (11, 3), (11, 3))
Anscombe's quartet - 통계 데이터
groups.agg(['mean', 'std', 'var'])
Anscombe's quartet - 그래프
fig = plt.figure()

ax1 = fig.add_subplot(2, 2, 1)
ax2 = fig.add_subplot(2, 2, 2)
ax3 = fig.add_subplot(2, 2, 3)
ax4 = fig.add_subplot(2, 2, 4)

ax1.plot(dataset_1['x'], dataset_1['y'], 'o')
ax2.plot(dataset_2['x'], dataset_2['y'], 'o')
ax3.plot(dataset_3['x'], dataset_3['y'], 'o')
ax4.plot(dataset_4['x'], dataset_4['y'], 'o')

fig.suptitle("Anscombe Data")
fig
2-2. Matplotlib
Import Library
import numpy as np
import pandas as pd

import matplotlib.pyplot as plt
단일 그래프
plt.figure()
plt.axes()
plt.show()
plt.plot(np.arange(2, 7))
plt.show()
다중 그래프
plt.figure(figsize=[15, 5])

plt.plot(np.arange(5))
plt.plot(np.arange(2, 7)

plt.show()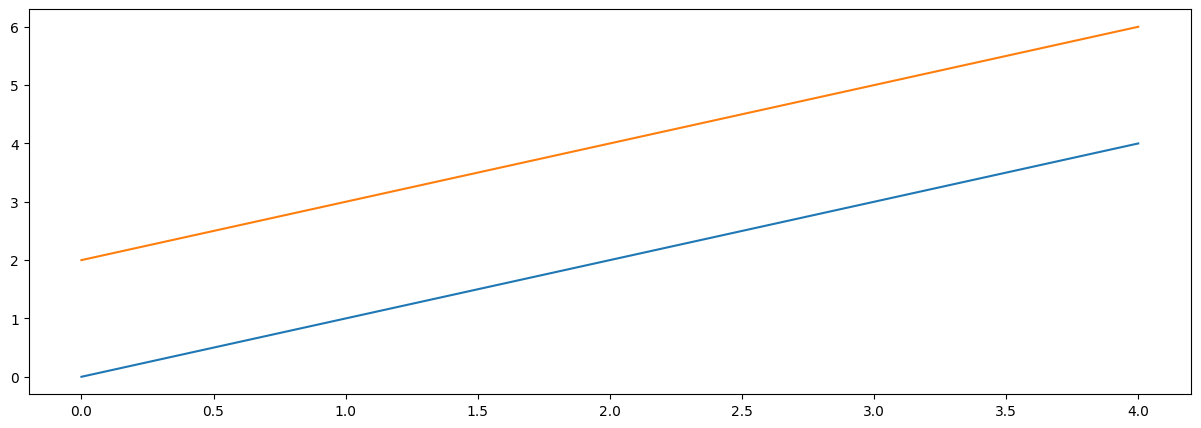
fig, ax = plt.subplots(2, 2, figsize=[15, 5])

ax[0, 0].plot(np.arange(5))
ax[0, 1].plot(np.arange(5))
ax[0, 1].plot(np.arange(2, 7))
ax[1, 0].plot(np.arange(3))
ax[1, 1].plot(np.arange(7))

plt.show()
타이틀 추가
타이틀에 한글을 쓸 경우, 라이브러리들을 import하기 전에 koreanize-matplotlib 모듈을 설치한다.
! pip install koreanize-matplotlib

import matplotlib.pyplot as plt
import koreanize_matplotlib
fig, ax = plt.subplots(2, 2, figsize=[15, 10])
fig.suptitle("그래프 연습")
ax[0, 0].set_title("그래프 1")
ax[0, 0].plot(np.arange(5))
ax[0, 1].set_title("그래프 2")
ax[0, 1].plot(np.arange(5))
ax[0, 1].plot(np.arange(2, 7))
ax[1, 0].set_title("그래프3")
ax[1, 0].plot(np.arange(3))
ax[1, 1].set_title("그래프4")
ax[1, 1].plot(np.arange(7))
plt.show()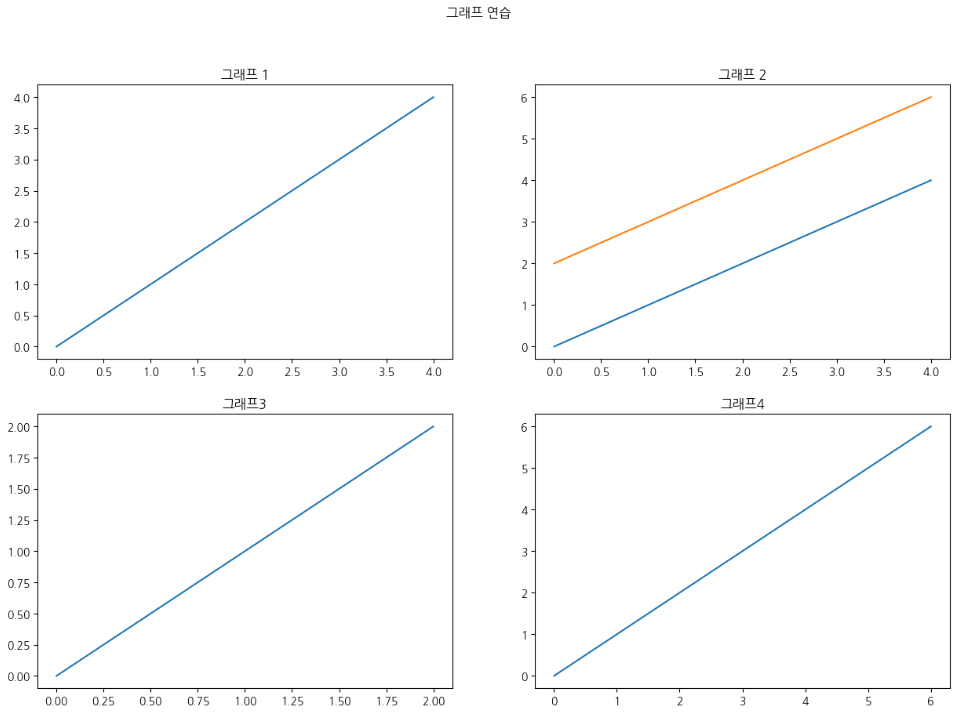
'SK네트웍스 Family AI캠프 10기 > Daily 회고' 카테고리의 다른 글
| 18일차. Data Visualization(Seaborn) & Data Cleaning (0) | 2025.02.05 |
|---|---|
| 17일차. Data Visualization (1) | 2025.02.04 |
| 15일차. 데이터 분석 & Pandas (1) | 2025.01.31 |
| 13-14일차. 단위 프로젝트(프로그래밍과 데이터 기초) (0) | 2025.01.24 |
| 12일차. Crawling (0) | 2025.01.22 |


